
The Coastal Resources Division of the Georgia Department of Natural Resources participated in a new study released today aimed at comparing the amount of live bottom versus artificial reefs along the east coast of the United States.
Increasing human uses of the ocean have led to the co-occurrence of both natural and artificial habitats, like reefs, across the seafloor. However, the distribution and extent of these two types of reef habitats are not well understood, but are necessary pieces of information for ocean planning and resource management decisions.
A new study by NOAA’s National Centers for Coastal Ocean Science (NCCOS), NOAA Southeast Fisheries Science Center (SEFSC), Duke University, and state agencies calculates the amount of seafloor in the southeastern U.S. covered by artificial versus natural reefs. They found that artificial reefs cover several orders of magnitude less area on the seafloor than natural reefs.
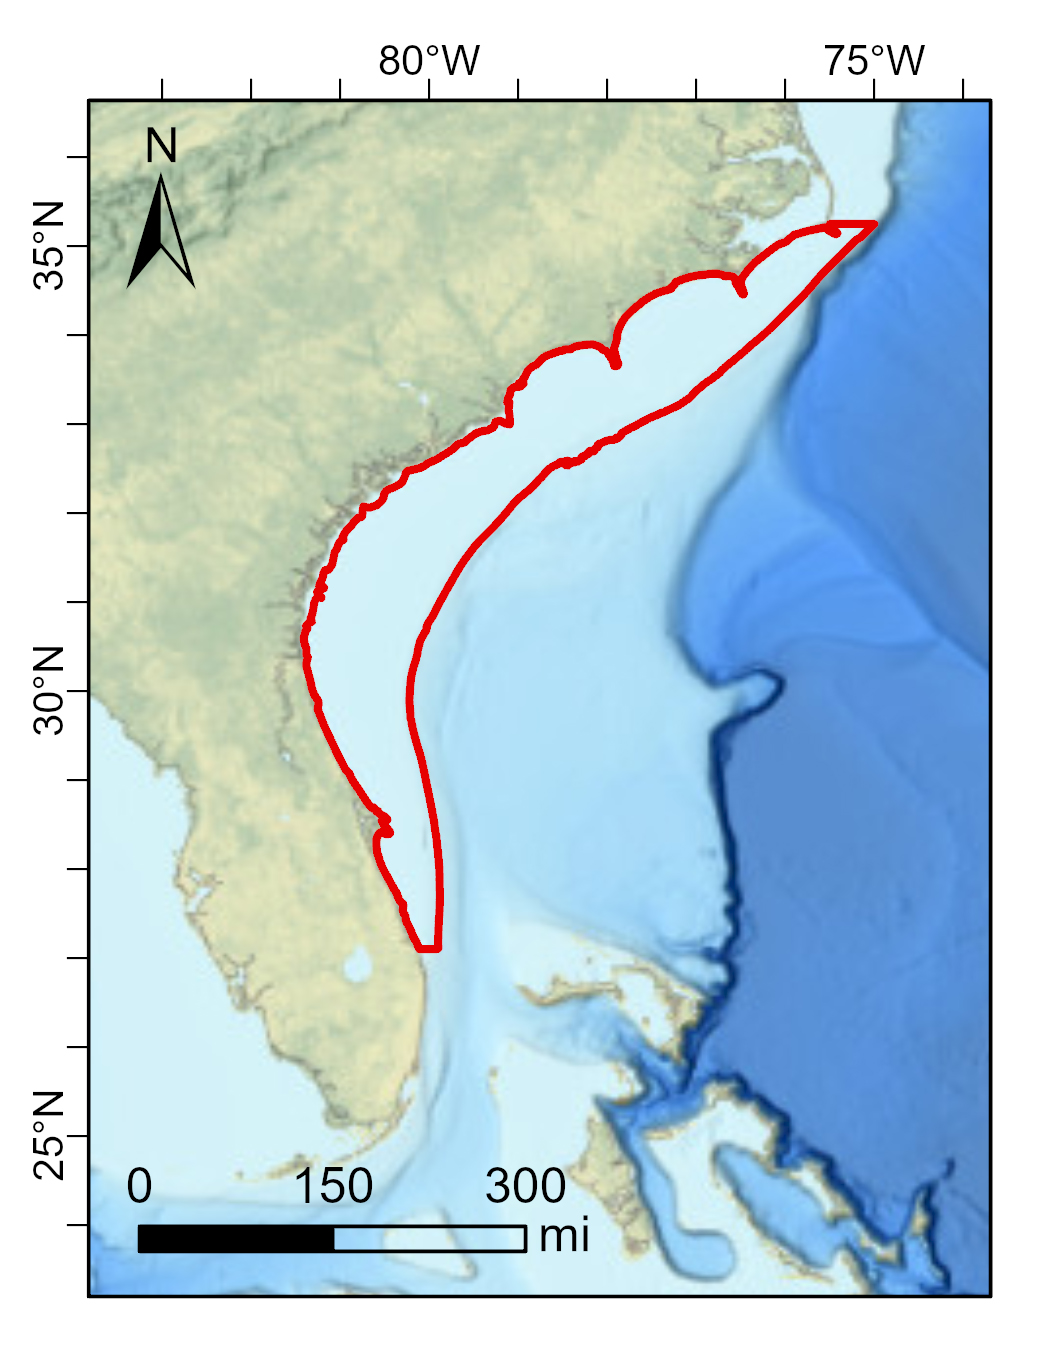
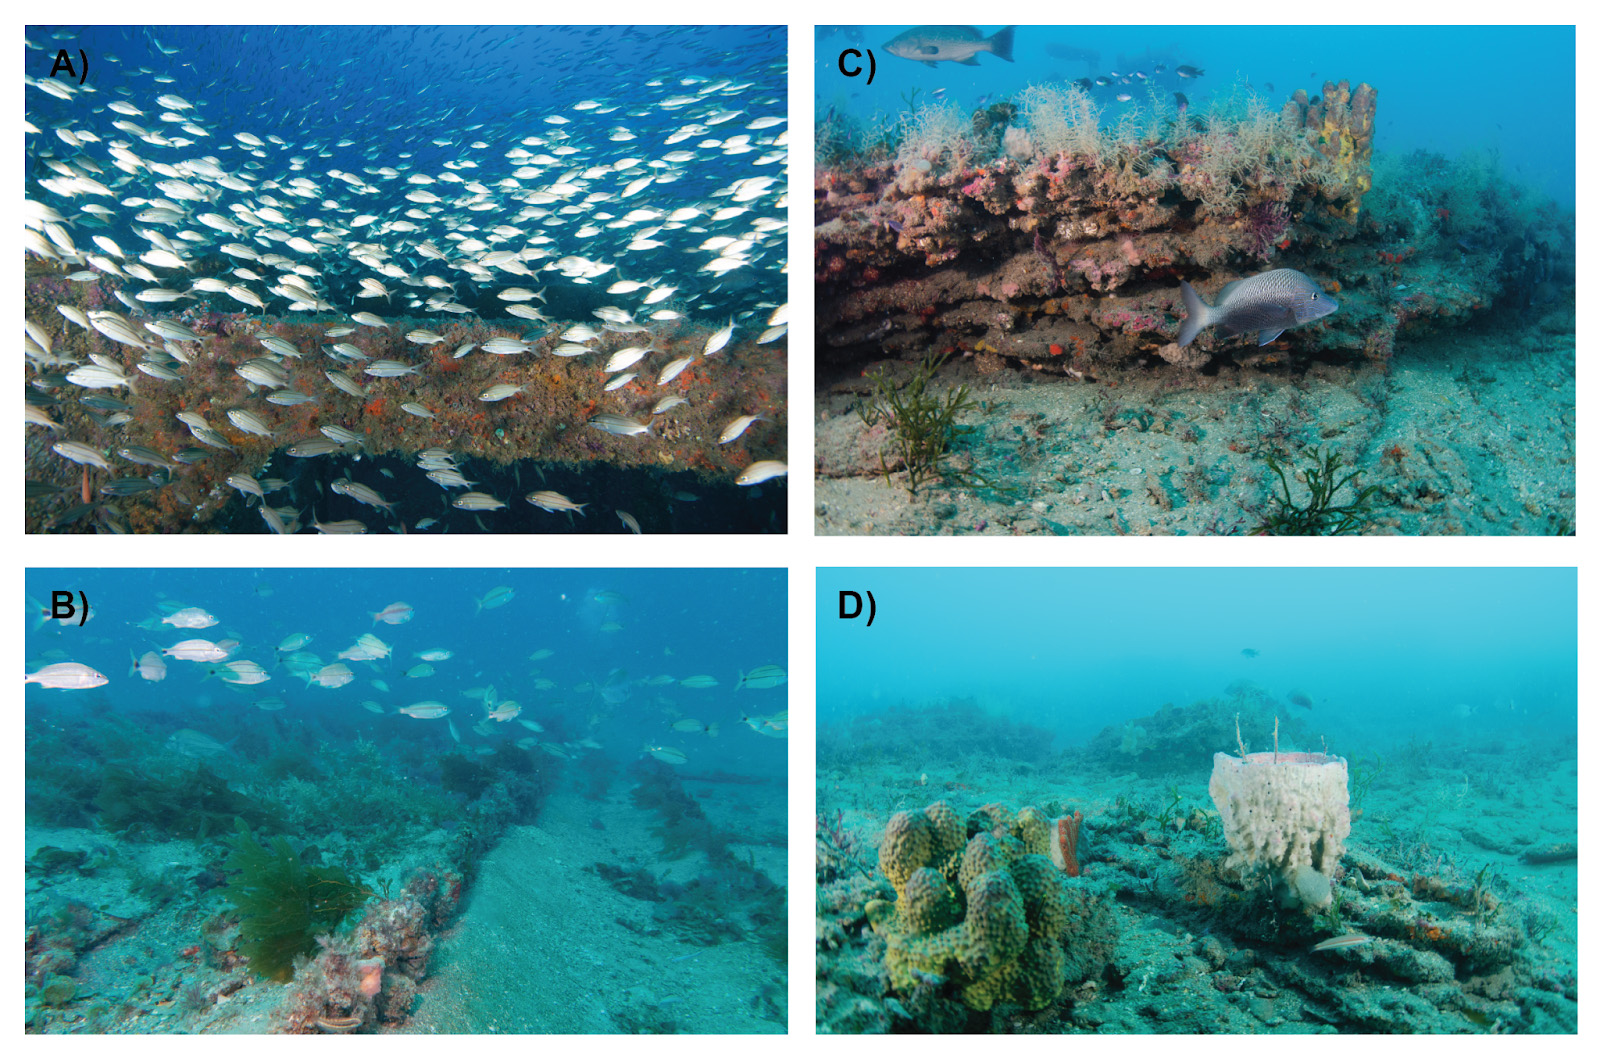
The team partnered with state resource management agencies from North Carolina, South Carolina, Georgia, and Florida to first calculate the footprint of artificial reefs and determined that artificial reefs occupy <0.01 percent (1.2 mi2, or about 560 American football fields) of the region. To our knowledge, this represents the first estimate of artificial reef extent in the region.
Seafloor mapping data and previously published models were then used to calculate natural reef extent, indicating that natural reefs constitute 2.6 percent (just over 1,000 mi2, or about the size of all metro Atlanta counties combined) of the study region. This refines previous estimates of natural reef coverage in the area, which ranged from 3 - 30 percent, using the best available data.
By providing the first calculations of artificial versus natural reef extent in the region, this study helps fill information gaps regarding reef habitat coverage and provides support for fisheries and ecosystem-based management. It also exposes the need for expansive seafloor mapping and characterization efforts to help refine reef coverage estimates in the southeast US and in other regions of the country.
Citation: D.N. Steward, A.B. Paxton, N.M. Bacheler, C.M. Schobernd, K. Mille, J. Renchen, Z. Harrison, J. Byrum, R. Martore, C. Brinton, K.L. Riley, J.C. Taylor, and G.T. Kellison. 2022. Quantifying spatial extents of artificial versus natural reefs in the seascape. Frontiers in Marine Science 9: 980384. DOI: 10.3389/fmars.2022.980384.


